Pair-programming a crevasse model with Fable 5
I used glacier mechanics, weather hindcasts, and a lot of validation work to build a crevasse-hazard evidence system for the Mont Blanc massif.
If you know me, you know I tend to disappear down rabbit holes and then build my way out of them, or further into them. I had just come back from glacier-traverse and ice-climbing training, plus my first 3,800-metre peak. Building this was my way of learning more about glaciers: how they move, where they barely move at all, and the dangers that come with crossing them.
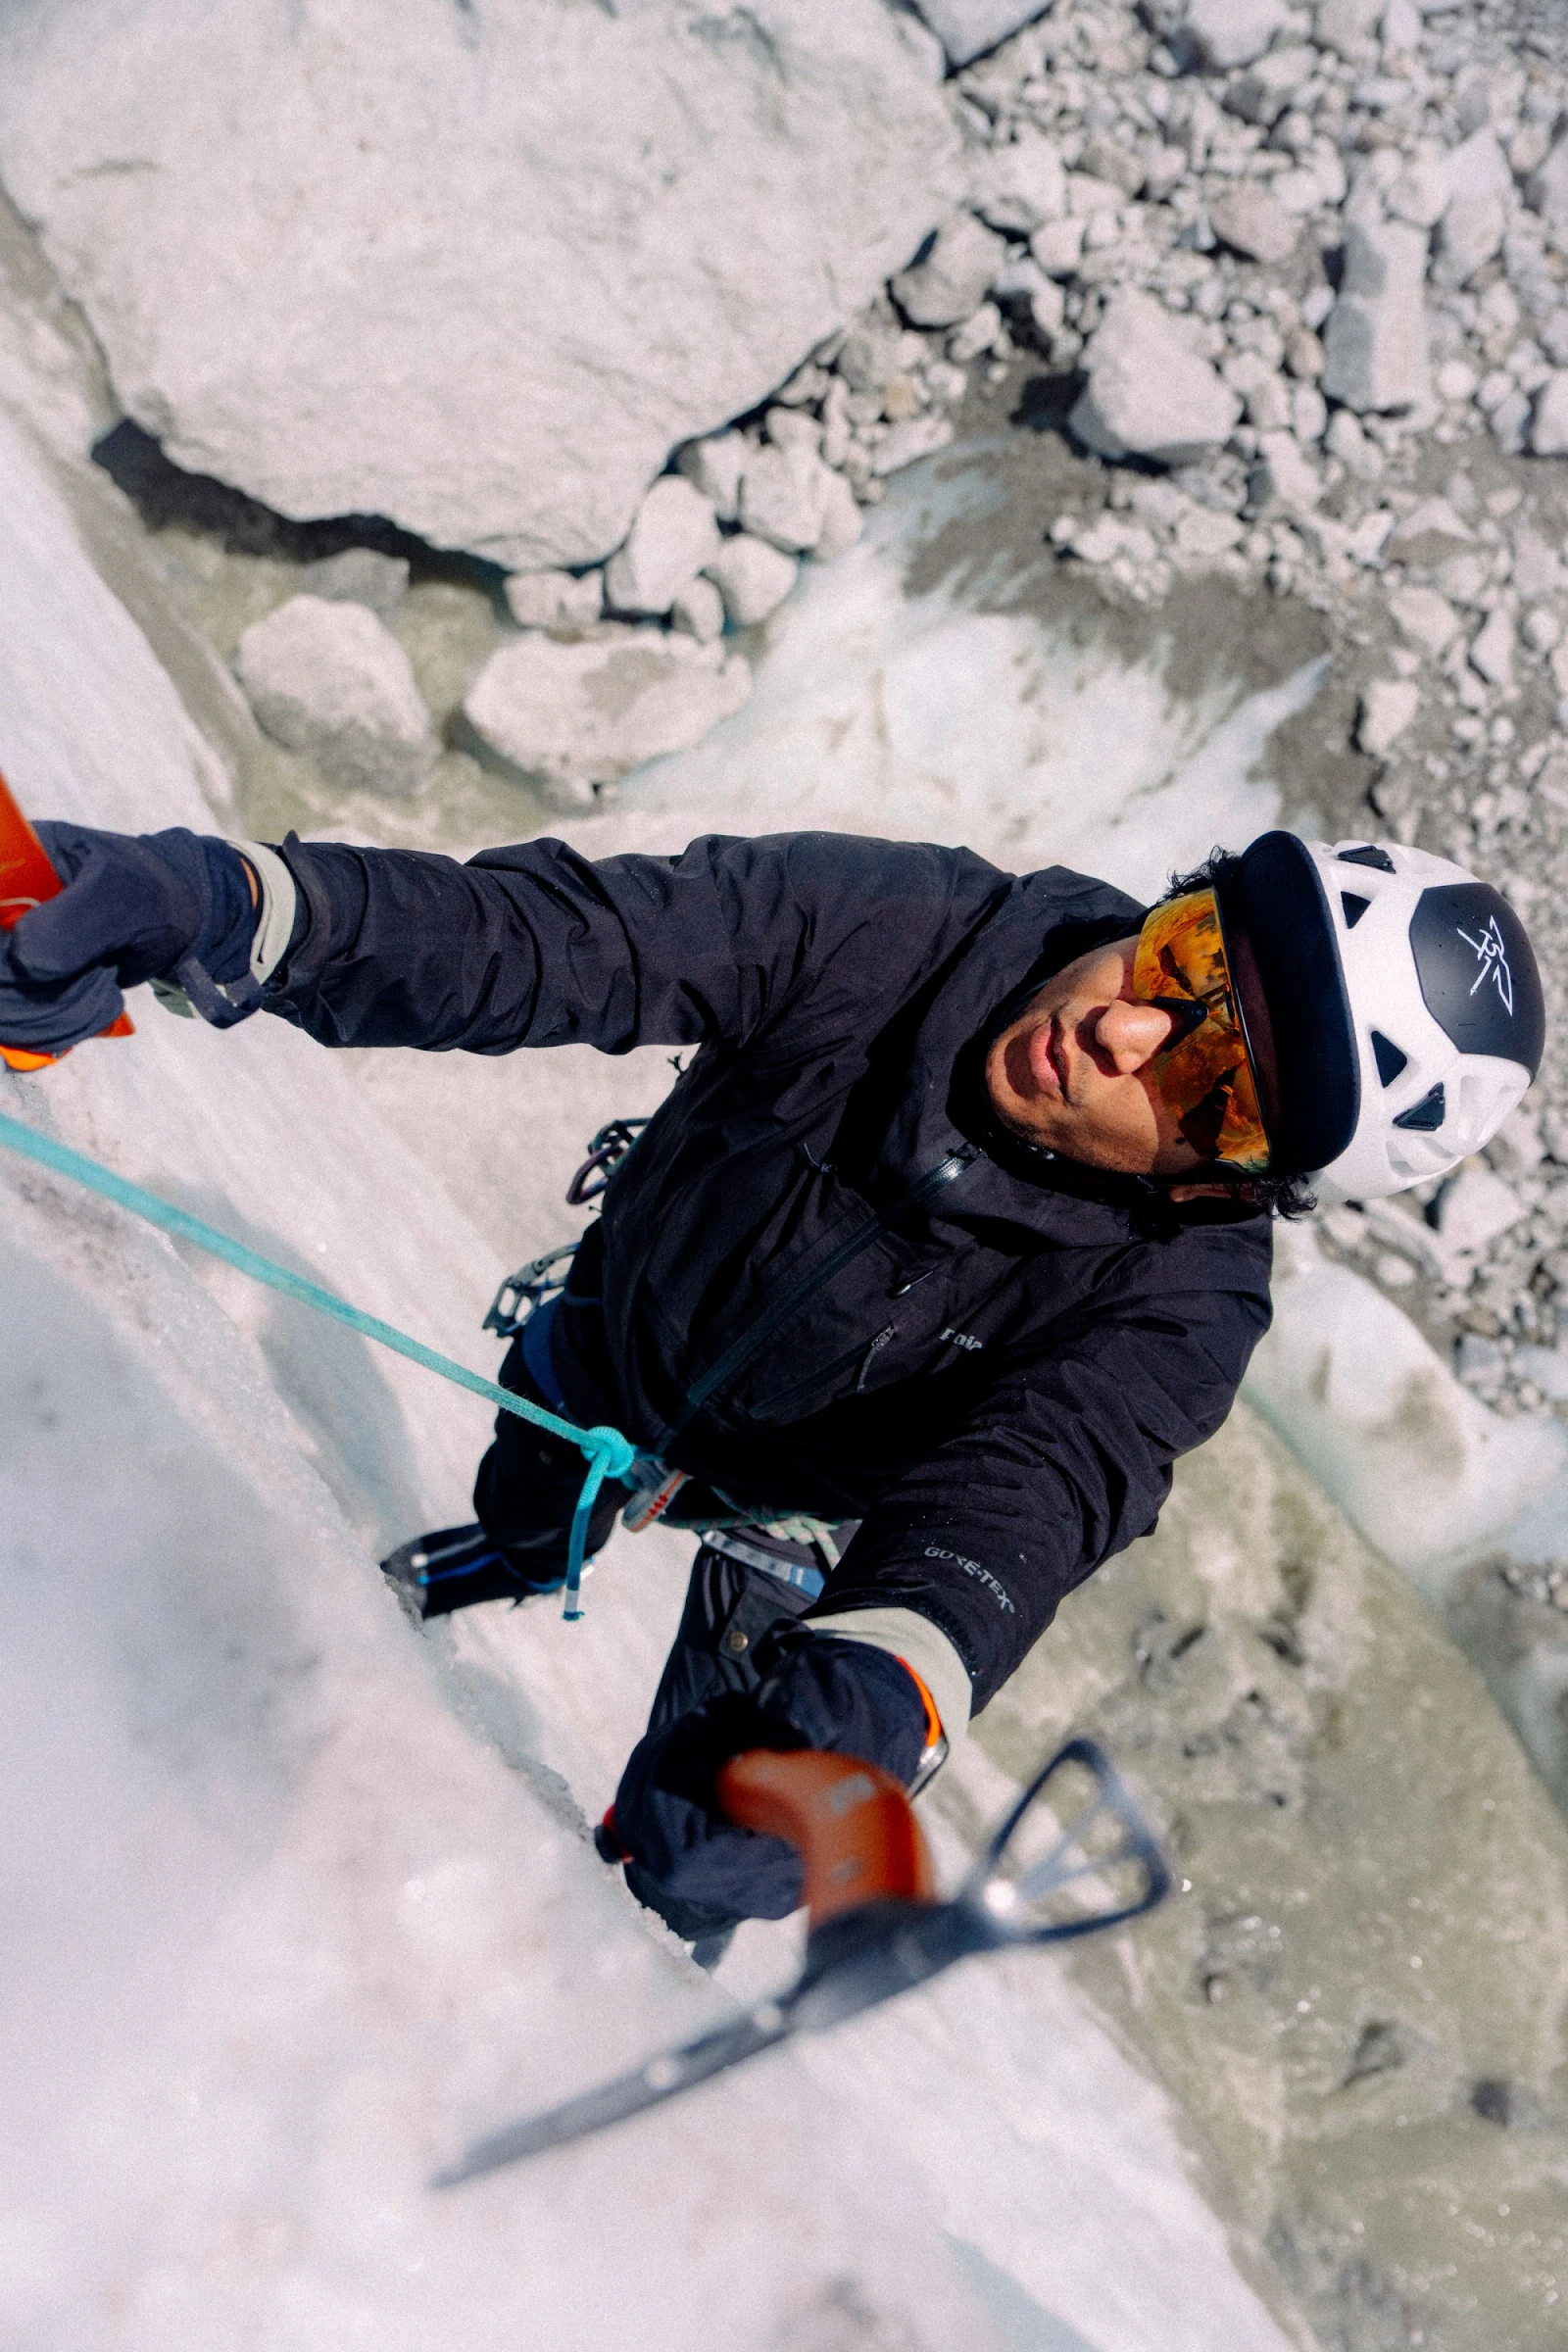
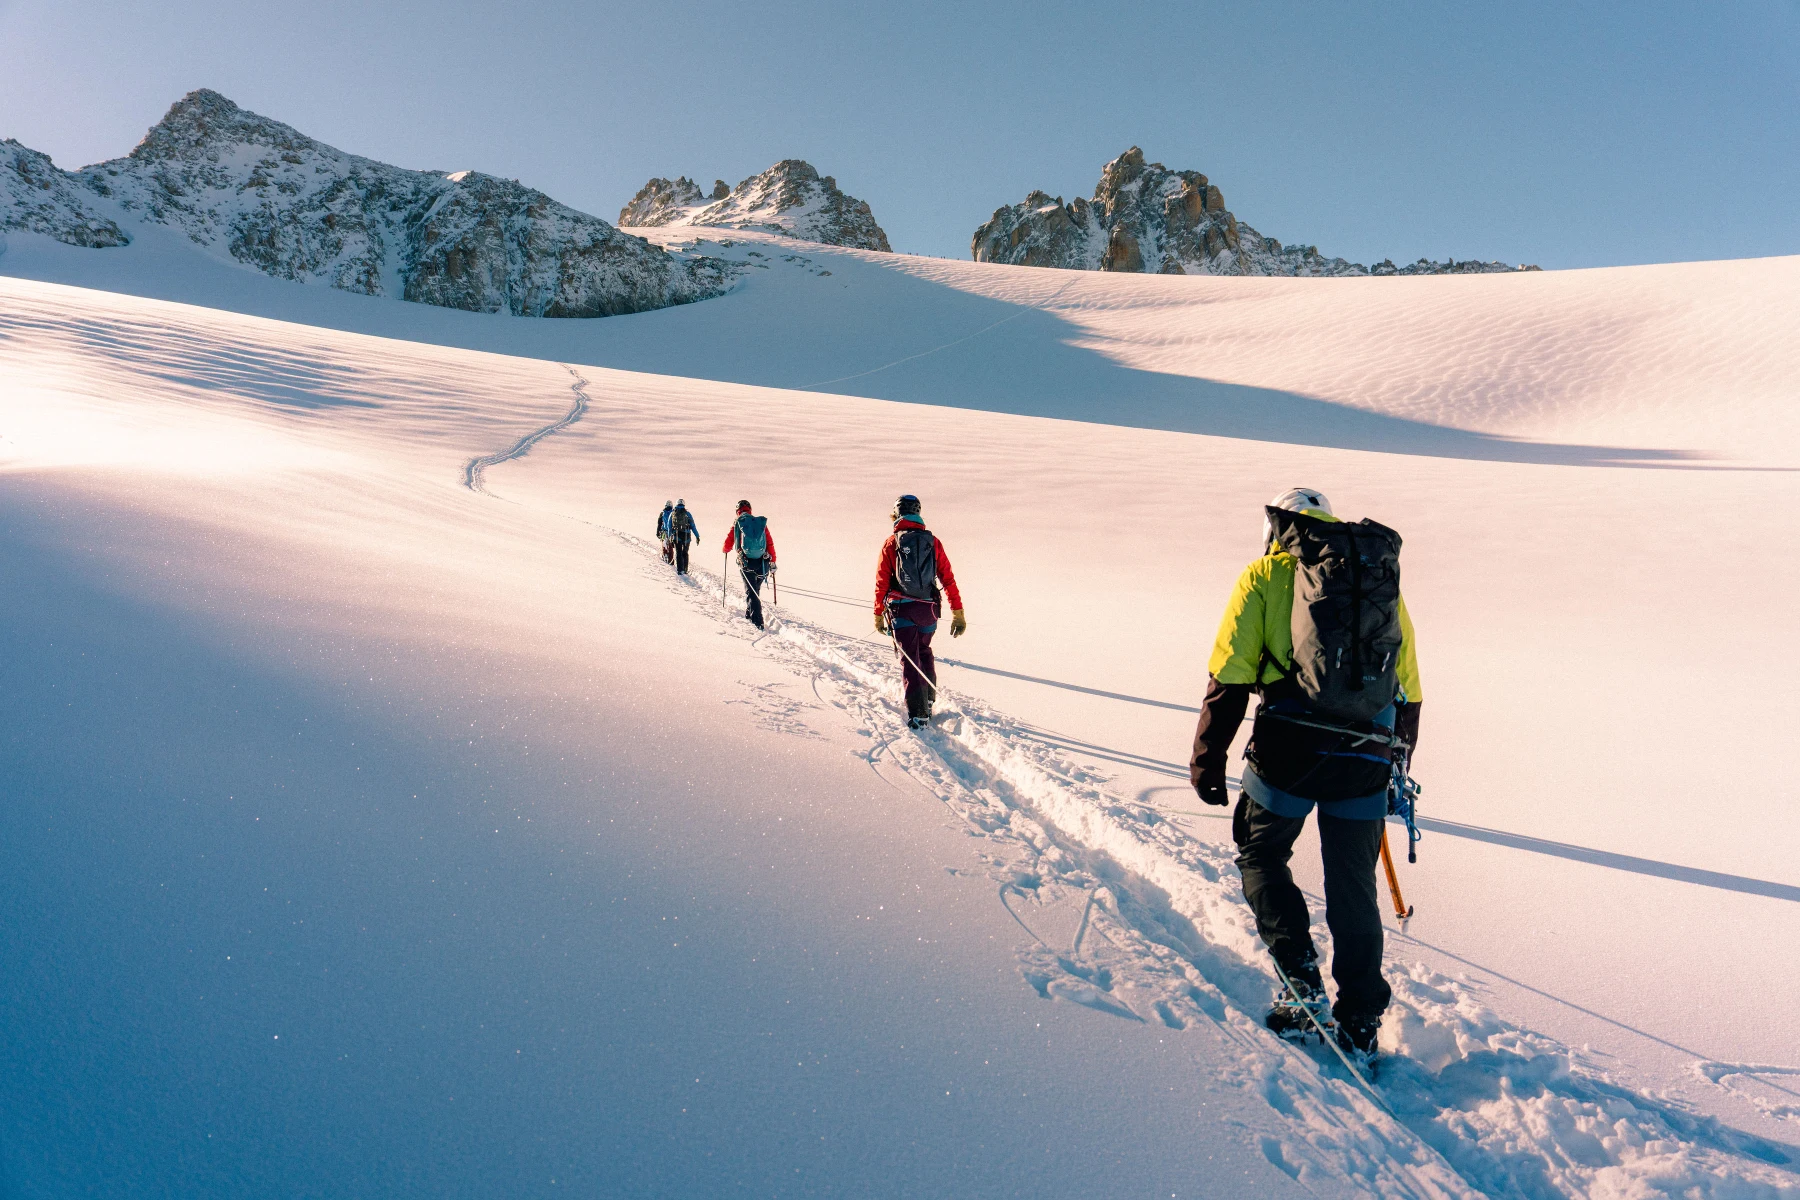
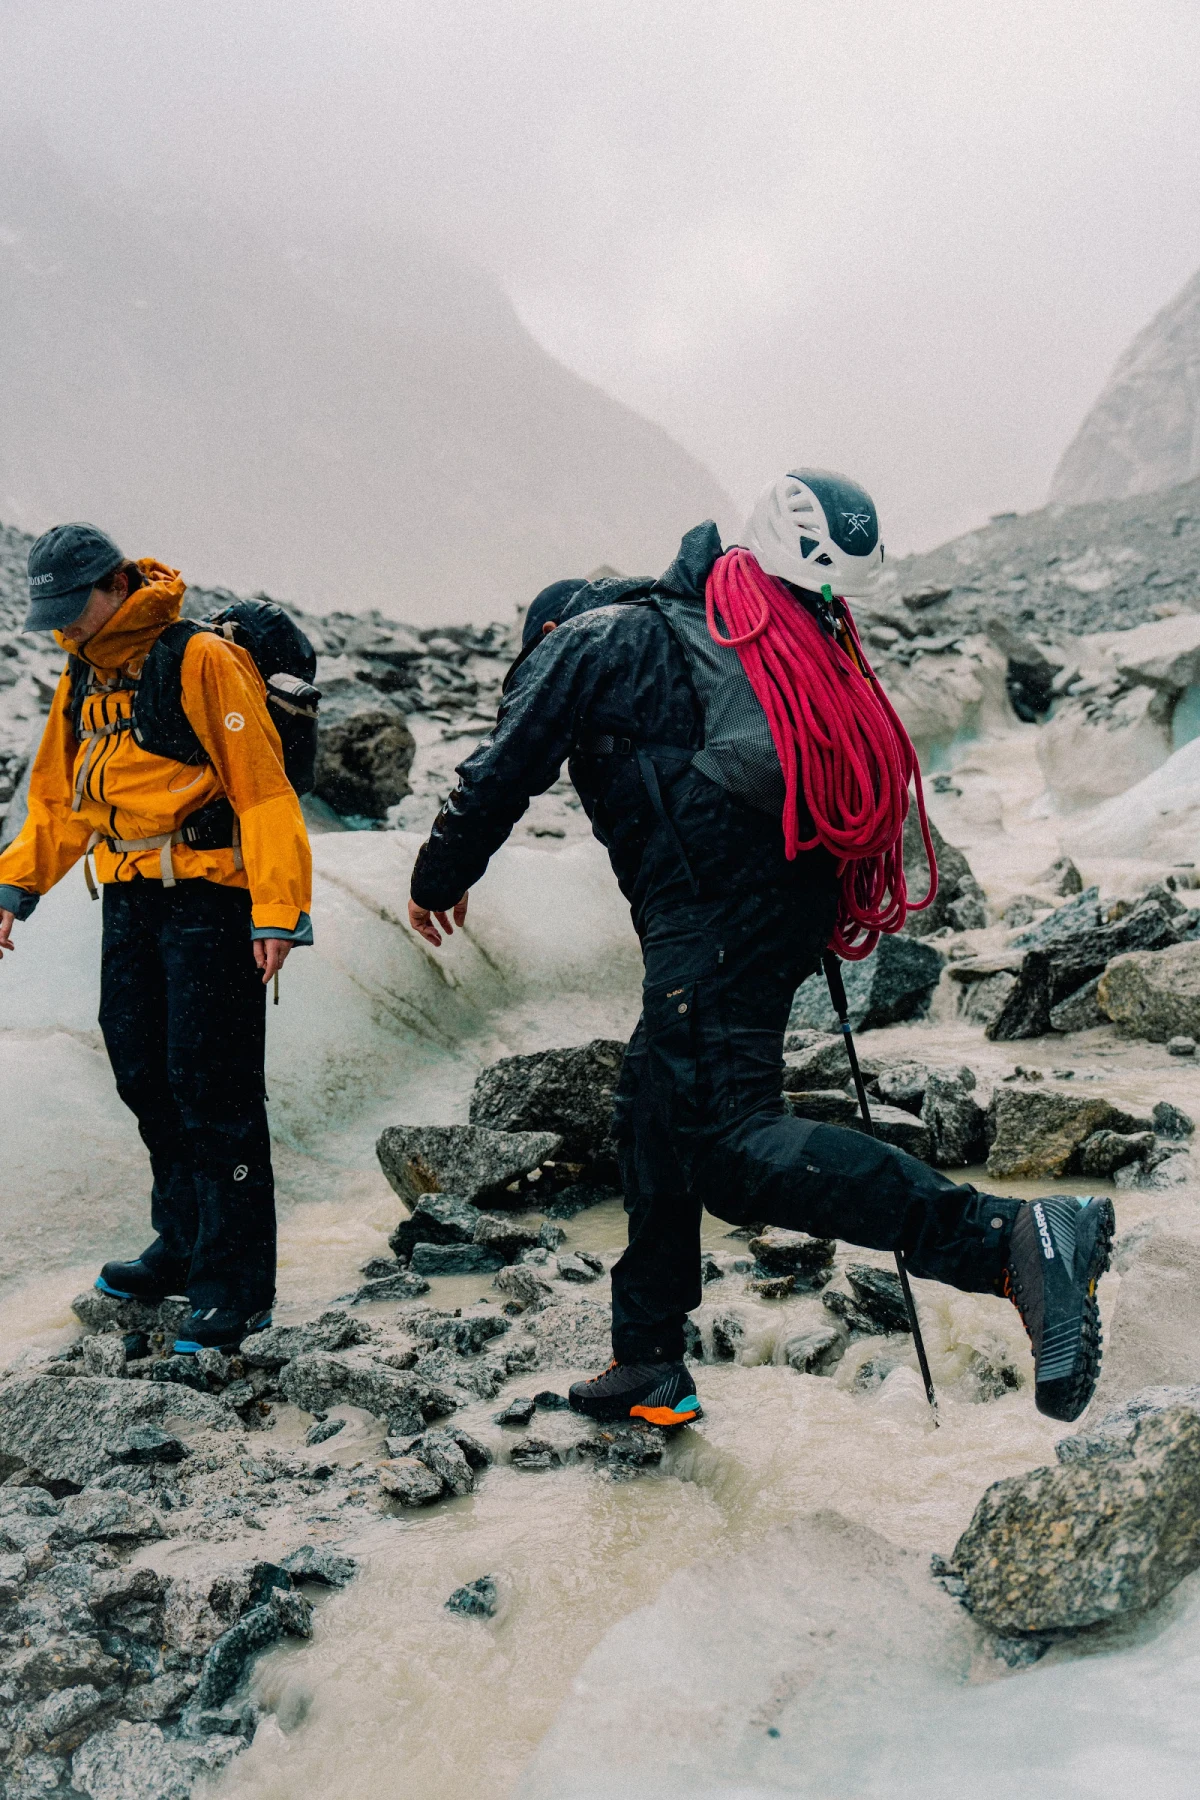
Amazing photos by Jade Stephens
A few days after Anthropic released Claude Fable 5, the US government ordered the company to suspend access globally over security concerns.
Before access disappeared, I spent several days using it to build a project I had wanted for a long time: a deterministic, provenance-tracked crevasse-hazard system for the Mont Blanc massif.
This is how I put the model, data pipeline, and validation checks together, and where the AI help was useful.
Breaking down crevasse hazard
If you spend time in glaciated mountains, you know that professionals such as guides, rescue teams, and ski patrols assess crevasse hazard using a mix of memory, recent observations, and weather bulletins. There is no operational tool that unifies the available geospatial measurements.
I wanted the application to show the physical components behind crevasse hazard. I split it into four parts:
- Structural susceptibility: Where do glacier mechanics favor crevasse formation? Quasi-static, based on months or years of data.
- Open-crevasse likelihood: Is a crevasse likely open at this location right now? Based on structural susceptibility plus observational evidence.
- Concealment and bridge state: Is snow likely hiding crevasses here, and how weak are the snow bridges? Driven by snowpack and forecast weather.
- Forecast evolution: How do the conditions change over the next 6, 12, or 24 hours?
I set one rule early: No probabilities without labels. I still need human-digitized crevasse maps for calibration, so every output is marked as an uncalibrated index. It is planning evidence for trained professionals and should never be used as a go/no-go decision.
Pair-programming with Fable 5
I started with a stack of glaciology papers: Hambrey & Müller on ice deformation, Vaughan on relating crevasses to surface strain rates, and Reynolds et al. on stress calculations for crevasse depths.
Fable 5 could hold the math, code structure, and scientific caveats in one working context. That helped me turn the papers into a software design and an offline Python pipeline.
I built pipeline/crevasse/strain.py to compute the full strain-rate tensor from a published 40-meter monthly surface-velocity archive. The stress formulation mattered, so the implementation uses the full effective strain rate with the vertical term derived from incompressibility.
I then built pipeline/crevasse/susceptibility.py to turn that strain into an uncalibrated susceptibility index. It uses a log-uniform exceedance across the published crevasse-onset range of 0.004 to 0.16 a-1.
velocity
DEM
outline
strain.py
Computes the strain-rate tensor, principal extension, shear, and incompressibility-derived vertical term.
ε̇₁
ε̇₂
ε̇zz
susceptibility.py
Scores each cell against the literature crevasse-onset range without calling it a probability.
0.004–0.16 a⁻¹
index 0–1
AP 0.95
base 0.61
layer-*.json
*.meta.json
Leaflet
Selection
I also wrote analytic kernel tests for uniform extension, simple shear, incompressibility, and zero strain under rigid rotation. The rigid-rotation test caught a half-pixel registration bug that would have displaced every advected feature by 20 meters.
Validating the physics
The validation suite is part of the product. The Methods & Validation tab reads the JSON artifacts published by the pipeline, so the text and charts use the same source.
These are the current validation results.
Temporal holdout
I ran a strict temporal holdout: 57 months of velocity data from 2016 to 2020 for training, followed by 35 unseen months from 2021 to 2024 for testing.
With held-out principal extension above 0.04 a-1 as the strict threshold, massif-wide average precision was 0.95 against a no-skill base rate of 0.61, a 1.55x skill ratio. I also ran 800-meter spatial-block cross-validation. The result held across all nine glaciers.
Strict truth: held-out ε̇₁ > 0.04 a-1
Permissive truth: held-out ε̇₁ > 0.01 a-1
Forecast hindcast
I ran a 365-day hindcast from June 2025 to May 2026, comparing the timing guidance with ERA5 reanalysis.
At 3077 meters on the mid-glacier band of the Mer de Glace, overnight minimum temperature had a mean absolute error of 1.56 °C and refreeze class accuracy of 83.6%. The forecast bridge-weakening index had a Pearson correlation of r = 0.93 with the ERA5-based index. The mean error for the predicted softening hour was 1.11 hours.
Overnight minimum temperature
Bridge-weakening index
Each dot is one forecast day. The diagonal is perfect agreement.
A failed experiment
I tried using a near-infrared high-pass roughness index from Sentinel-2 to detect crevasses on snow-free ice. It had no useful skill: AP was 0.50 against a base rate of 0.46. The snow-free tongue of the Mer de Glace is covered in rocky debris, which looks rough in the imagery even when it is not crevassed. The validation gate stopped that layer from being promoted.
The blackout
Then access to Fable 5 disappeared. The US government ordered Anthropic to disable access due to concerns about the model's capabilities in areas like cybersecurity and jailbreaking.
The long-context tool I had been using for the research work was suddenly gone.
What helped most was sustained context. I could keep papers, implementation details, tests, UI constraints, and scientific caveats in one thread while I worked through the system.
I now have a deterministic pipeline serving real glacier data to the web app, with validation checks at every stage. It still needs calibration against human-digitized crevasse maps before I would trust it as more than a research prototype.
I hope access comes back soon.