Succinct starts with the model a team already trusts, then measures which cheaper or faster model gets close enough for the task.
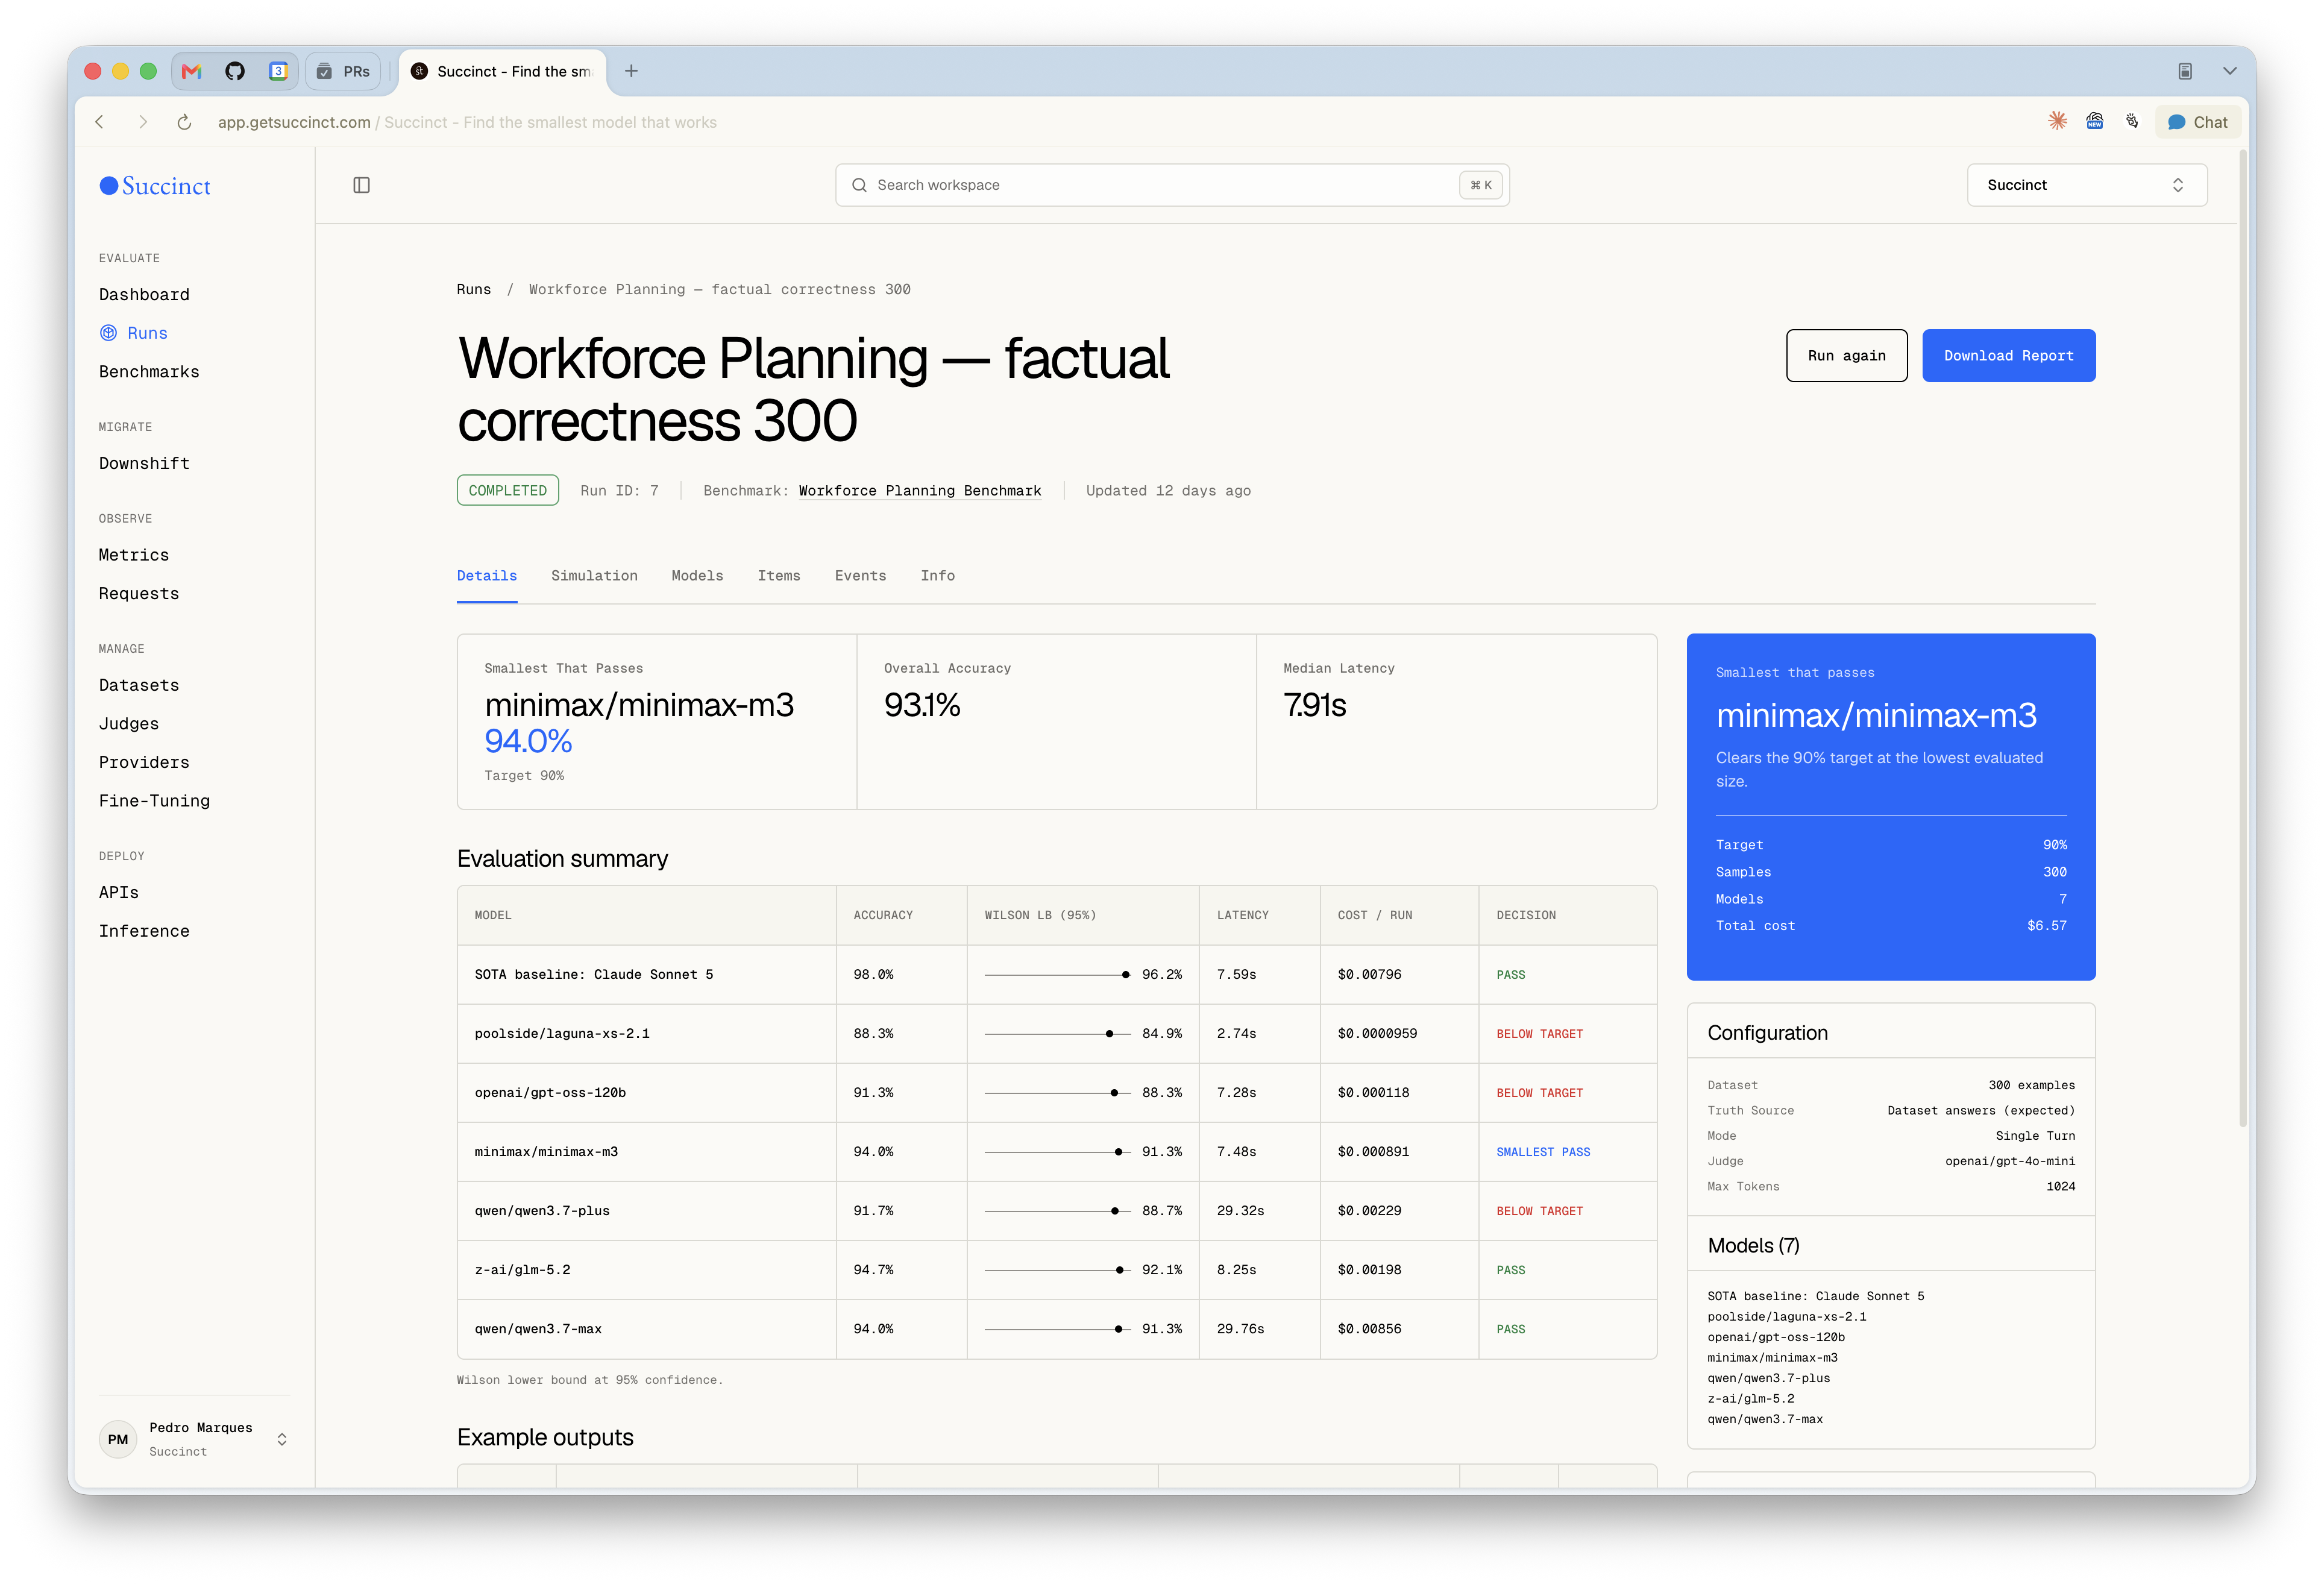
The run detail shows the selected model, confidence target, cost, dataset setup, and the examples behind each pass or failure.
The idea came from Personio's assistant. It was growing from one assistant into a multi-assistant, multi-agent system, with different calls doing very different jobs. Some were tool-heavy, some were mostly writing, but Sonnet was the default for all of them. With enough calls, that gets expensive quickly.
Most teams do not have time to write a detailed benchmark before a feature launches. The practical default is to use the latest, largest model they trust—Opus, for example—and move on. At Personio that default was Sonnet. It got the work moving, but it did not tell us whether every task needed the same model.
Succinct starts there. A user brings representative examples from the task and the trusted model they already use as a baseline. They do not need a complete set of hand-written reference answers on day one. Succinct runs cheaper candidates against the same task and asks which one gets close enough in quality while cutting cost and, when possible, latency.
Succinct is self-serve now. Anyone can sign up and run an evaluation without my help, although adoption is still very early. The only external app I know using it is a calorie calculator. It found a cheaper model and cut its model cost by roughly 35%, while keeping about the same accuracy. The newer endpoint and routing tools are things I currently use myself.
The product shape
That is the product bet: there is often a smaller model below the trusted default that is close enough for the task, and finding it should not require weeks of benchmark work. A task holds the examples and instructions. A judge defines what counts as close enough. A run evaluates an ordered model ladder and records quality, confidence, cost, and latency. With early stopping on, it stops at the first candidate that clears the bar, then leaves the final decision with the user.
Decision loop
Every run reduces model choice to four measured gates.
85%Target success rate
95%Confidence level
120Examples sampled
01 TaskFreeze the workload
Dataset rows, expected answers, rubric, sample size, and target quality are captured before the run starts.
/
02 JudgeTurn quality into pass/fail
Programmatic rules and an LLM judge record an auditable reason for every score.
/
03 LadderStart small and climb
Candidate models are evaluated in cost order, with tokens, latency, pass rate, and Wilson lower bound recorded.
The user sets the task, judge, model ladder, and statistical target. The backend runs the evaluation and streams progress into the interface.
Putting the decision on screen
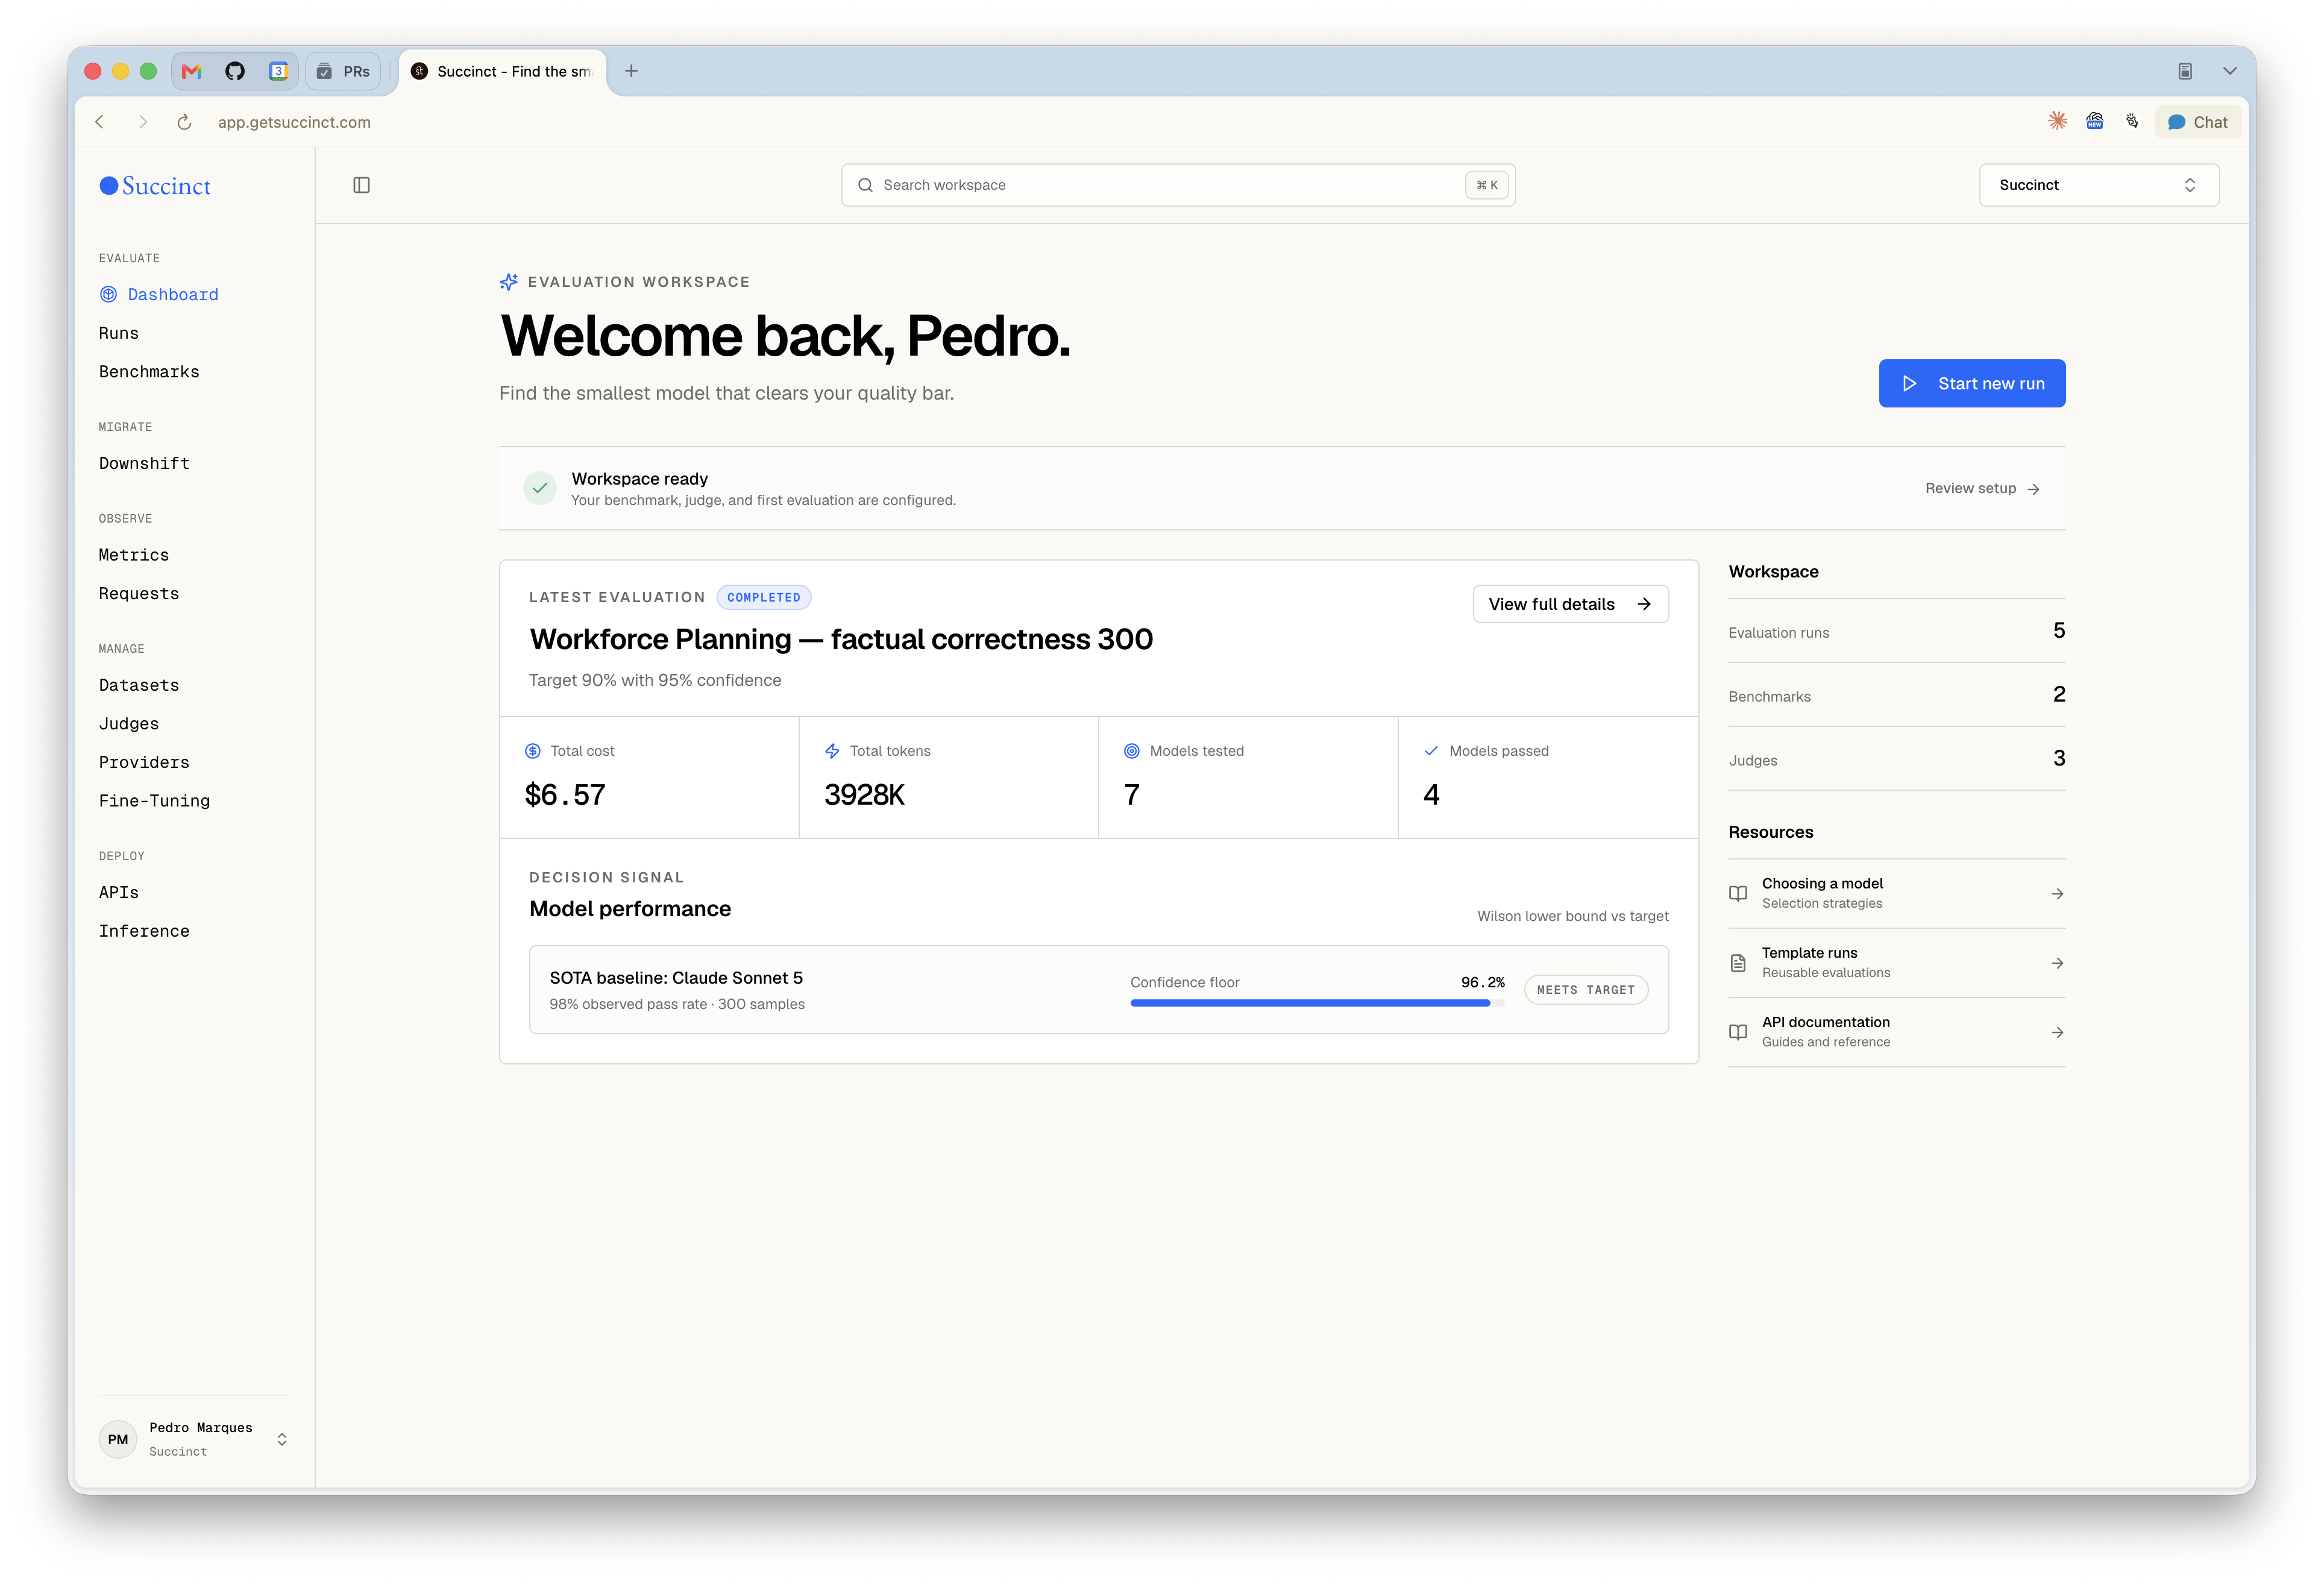
The dashboard opens with the steps needed to run an evaluation, then shows the latest result with its cost, token count, tested models, and number of passing models. I wanted the decision to appear before the charts.
The dashboard keeps workspace readiness, the latest evaluation, its cost and token footprint, and the current decision signal in one scan.
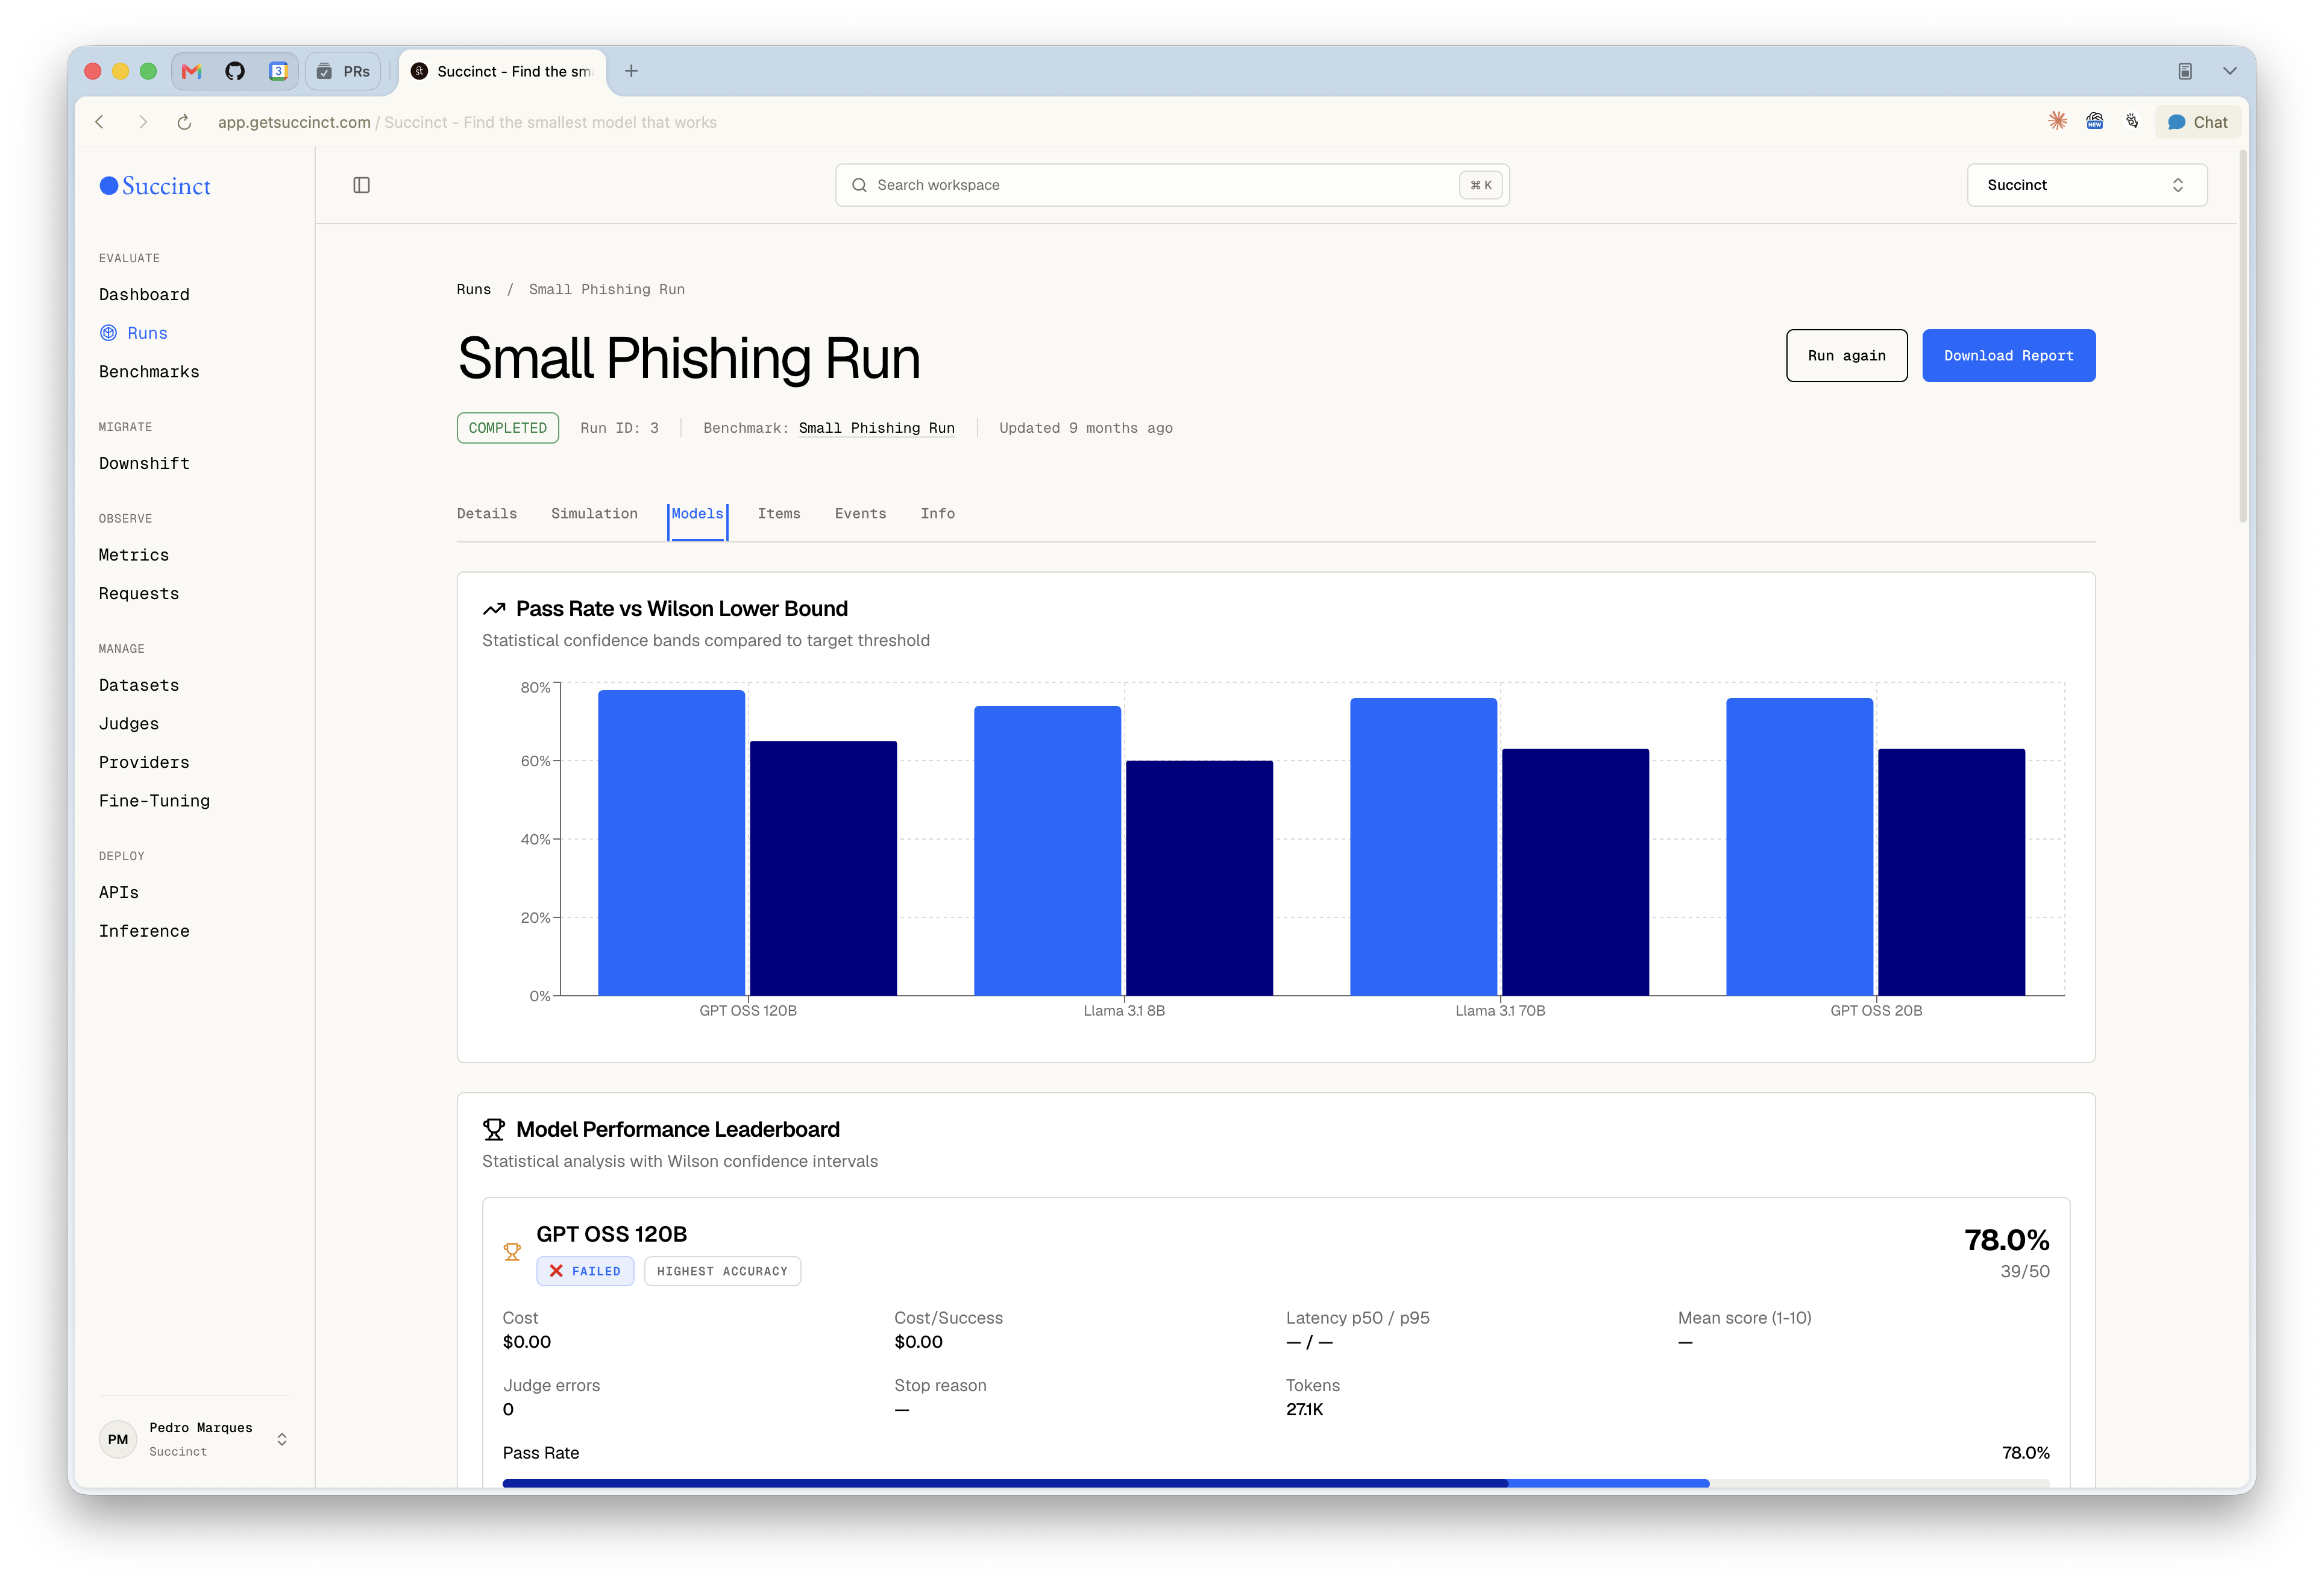
The Models tab puts observed pass rate next to the Wilson lower bound. Each candidate also carries its cost, latency, token use, judge errors, and final decision. I can see the raw result and the more cautious confidence estimate at the same time.
The first result I trusted
One of my first useful evaluations was performance-review summarisation. The reviews were anonymised, but I had written them and knew the context behind each one, including the tension between manager and peer feedback. That made it possible to judge whether a summary had caught what the review was really trying to say.
Sonnet was the incumbent. GPT-OSS produced writing that fit the tone I wanted better, and it was cheaper. I trusted that result because I knew the original material well enough to understand why the summaries felt better.
That early prototype helped start a production conversation. The eventual change happened separately inside Personio's Amazon Bedrock setup: some tasks later moved to Claude Haiku, and an ML engineer built a more robust internal benchmark. The prototype came before the current Succinct product and was one useful catalyst.
The Models tab separates observed accuracy from statistical confidence, then keeps the cost and latency evidence attached to each candidate.
The statistical decision
A raw pass rate is too optimistic for a model decision. If a model passes 102 out of 120 examples, the observed rate is 85%, but the lower confidence bound can still sit below the target. A completed run reports the Wilson lower bound. When early stopping checks the result repeatedly, Succinct uses an anytime-valid bound so those repeated checks do not make the evidence look stronger than it is.
In both cases, the rule is the same: choose the first model whose conservative quality estimate clears the configured threshold.
Smallest-pass finder
The first lower bound above target wins.
$0.037Winning run cost
84.2%Lower bound
1.12sAverage latency
Candidate 01
Llama 3.1 8B
Observed pass rate is 82.0%, but the Wilson lower bound is 75.5%. Too uncertain for an 84% target.
Candidate 02
Qwen3 32B
Observed pass rate is 89.0%. Its 84.2% lower bound clears the configured 84% target and it is cheaper than larger alternatives.
Candidate 03
Llama 3.1 70B
Higher quality, but more cost and latency. Kept as evidence, not selected as the default route.
Decision
Stop climbing
Use the smallest model that clears the configured quality target.
The first candidate whose lower confidence bound clears the configured quality target is selected.
What the price list misses
I initially distrusted a result where Claude came out cheaper than an open-weight alternative for a particular task. I had been looking too closely at input-token prices. Some models generate much more output or spend many more tokens reasoning, which can reverse the cost once the whole call is measured.
The lesson was specific: cost belongs to the task. Succinct records the input and output token counts, latency, cost, and result together so the comparison reflects what the application actually paid for.
Architecture
The system is split into a React evaluation console and a FastAPI service. The frontend uses Vite, React Router, TanStack Query, shadcn/Radix primitives, and Server-Sent Events. The backend uses FastAPI, async SQLAlchemy, Alembic migrations, PostgreSQL, OpenRouter-compatible model calls, and an async evaluation worker.
System map
A run is durable data plus a live event stream.
React console
Dashboard, datasets, judges, run setup, run detail, API keys, providers, inference, and fine-tuning surfaces. TanStack Query owns fetch/cache behavior.
ReactViteRadixRecharts
FastAPI service
Typed REST endpoints for tasks, judges, runs, models, API keys, providers, inference, organizations, and auth. SSE streams run events.
FastAPIPydanticSSE
Evaluation worker
Generates trusted references when needed, loops through the model ladder, scores each item, updates aggregate stats, records costs, and emits progress events.
asyncioOpenRouterWilson CI
PostgreSQL records
Tasks, judge definitions, runs, model evaluations, item evaluations, run events, users, organizations, provider config, API keys, and usage logs.
SQLAlchemyAlembicasyncpg
Deployment layer
After a run, the API-key surface makes the recommendation operational: restrict credentials to approved models, set RPM/TPM limits, track spend, and expose an OpenAI-compatible proxy for application code.
Each result keeps the task, judge, dataset, configuration, item evidence, aggregate metrics, and event log behind the chosen model.
Observe what happens in production
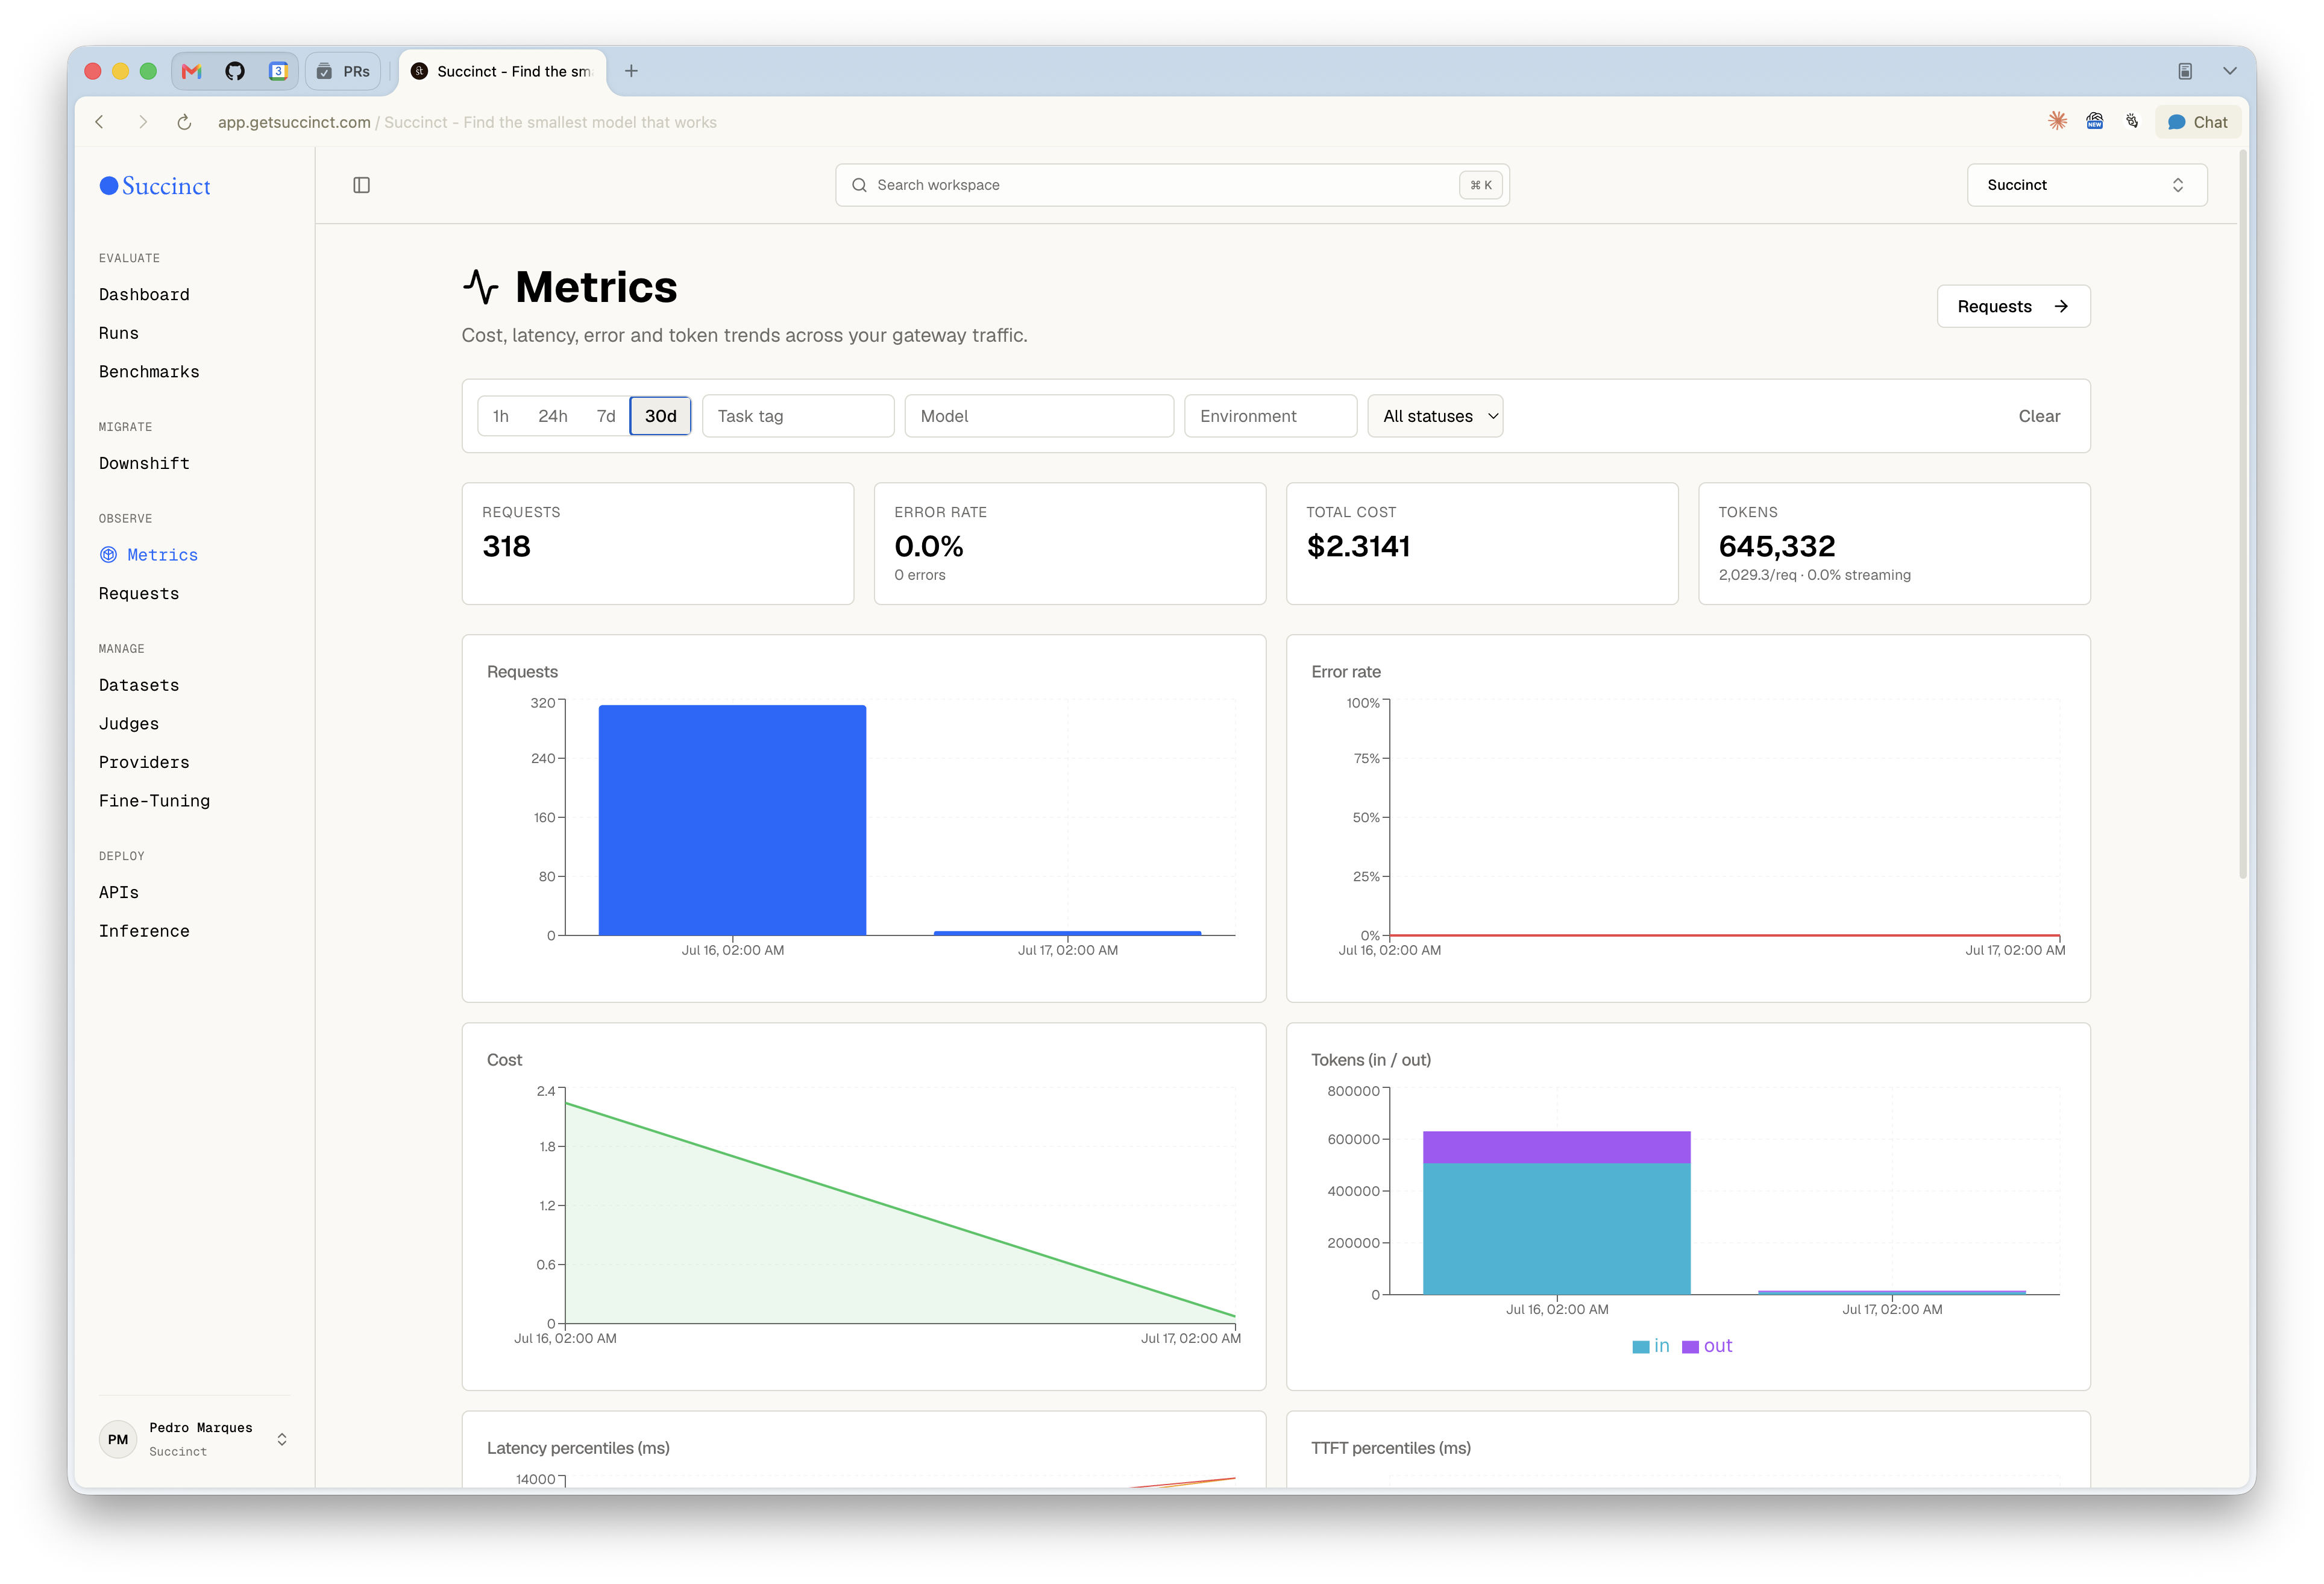
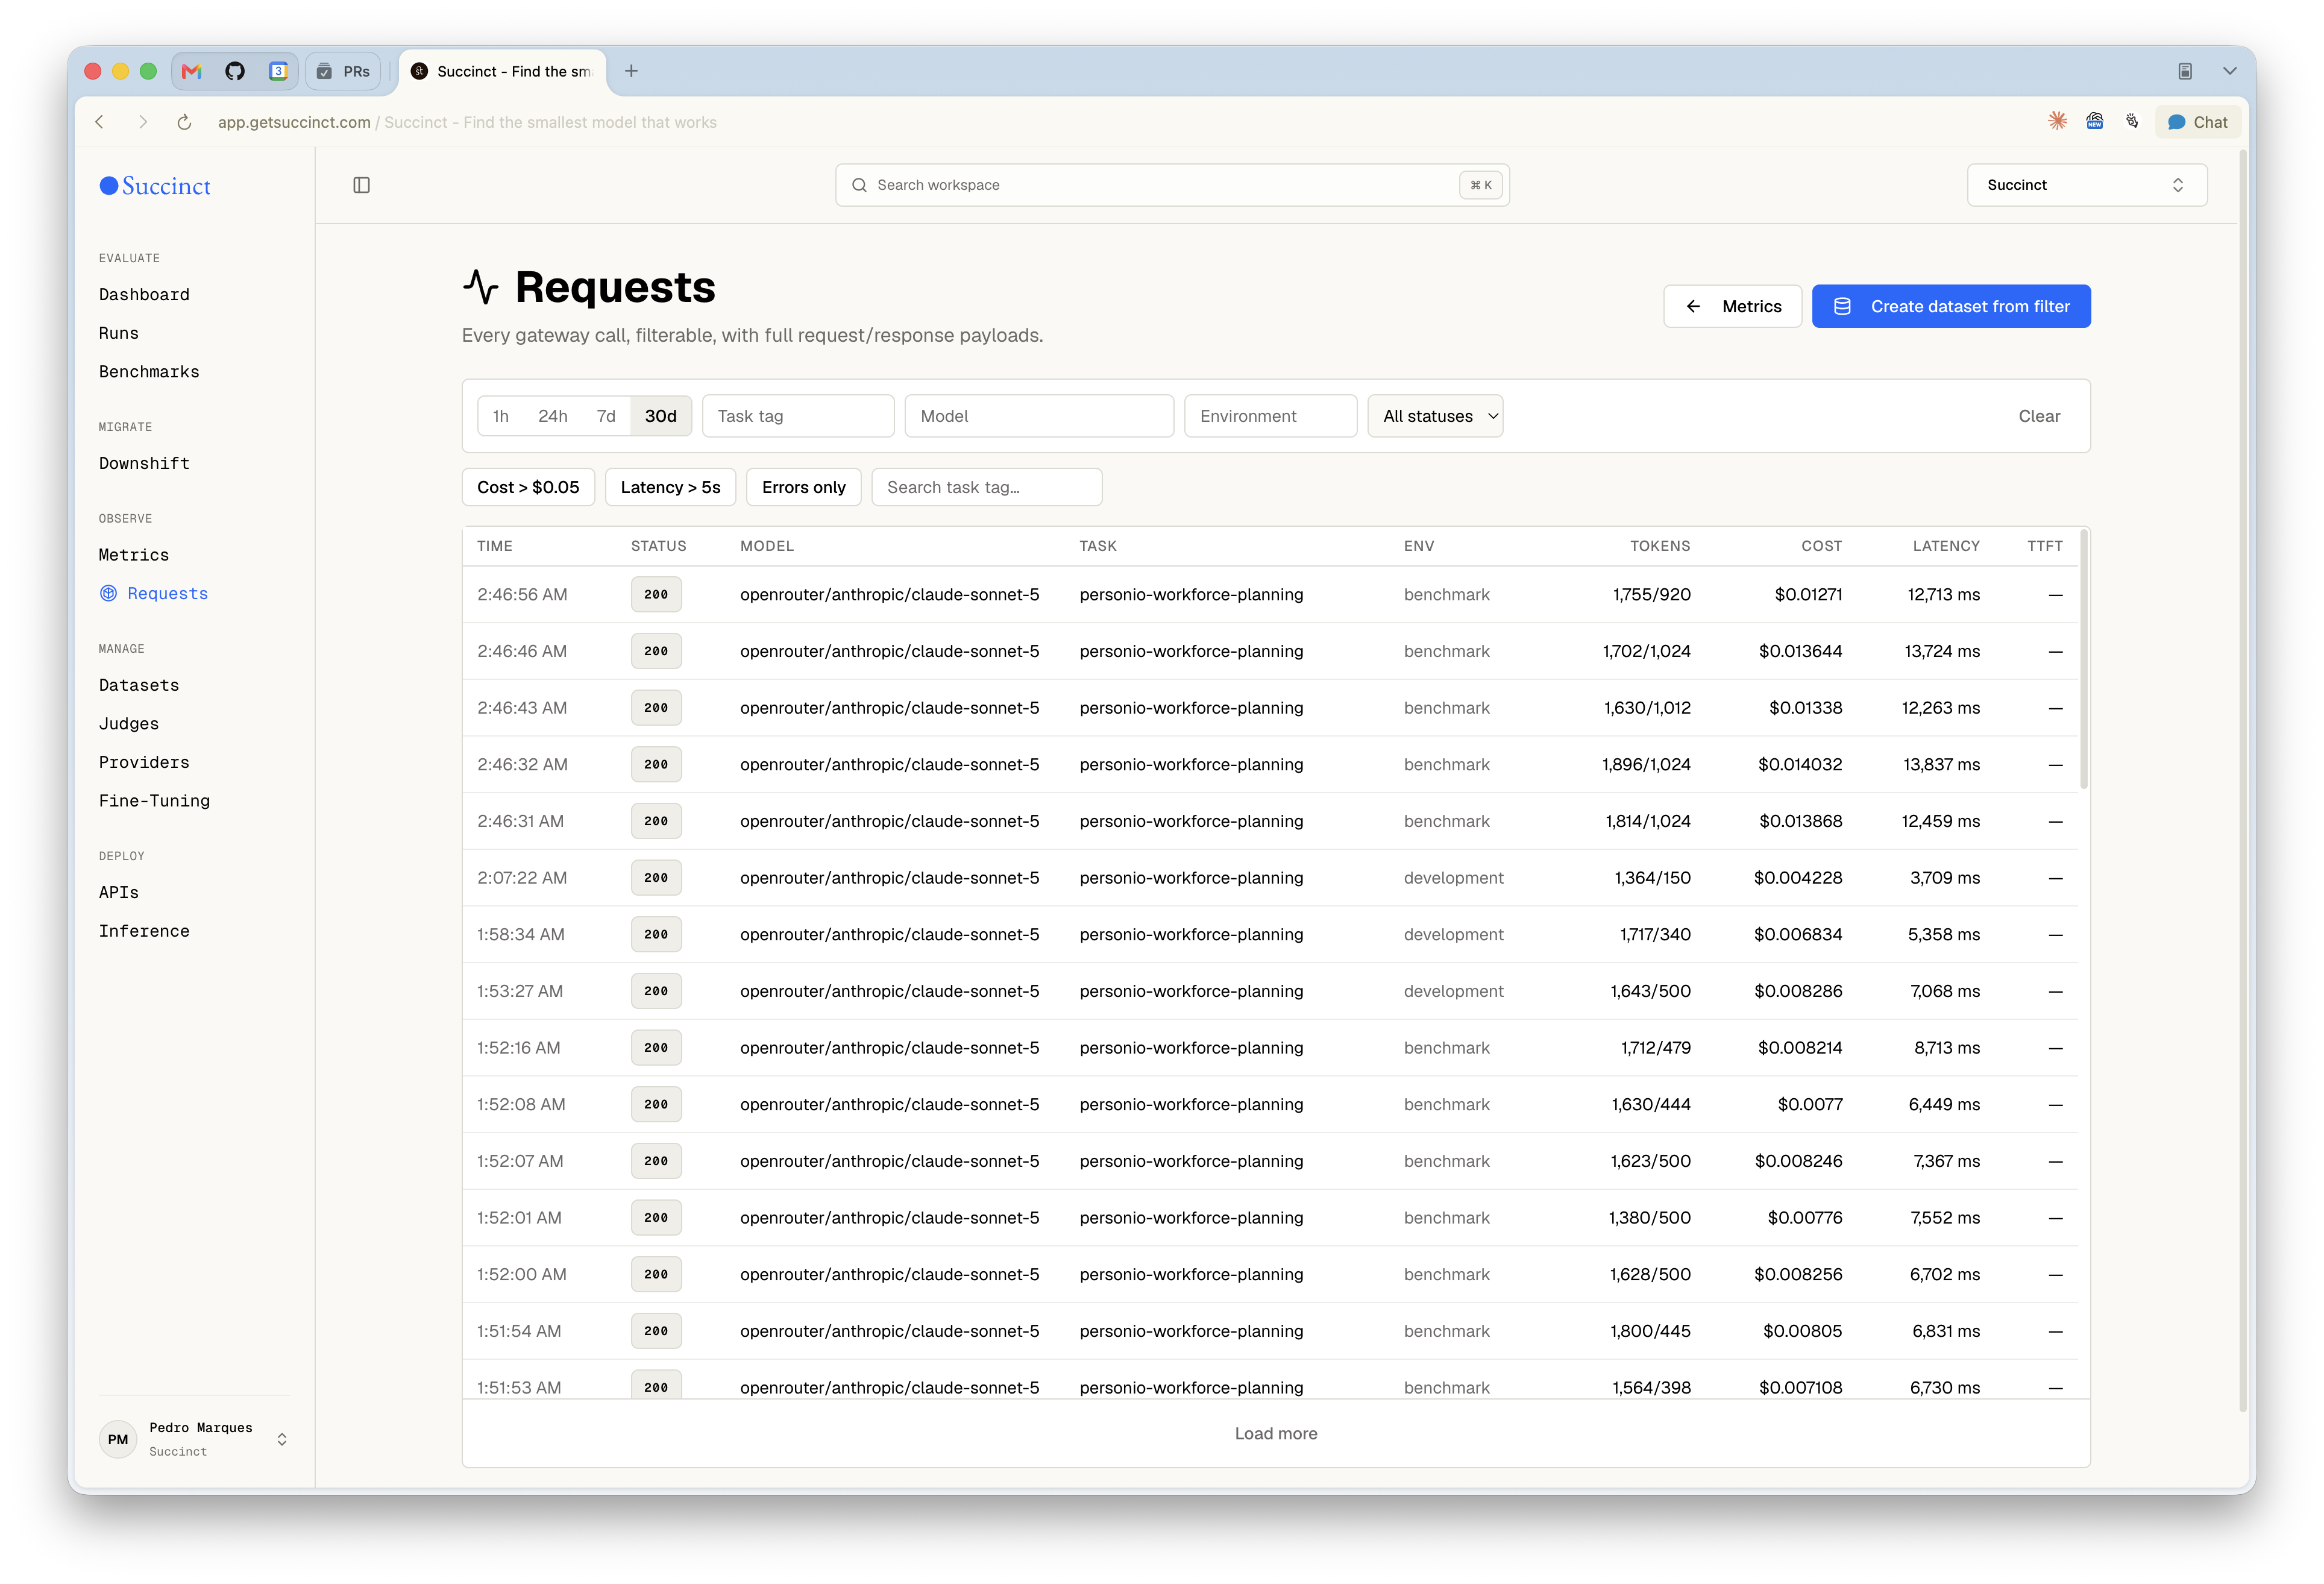
Observe sits behind Succinct's OpenAI-compatible gateway and records each completed call after the response returns. It stores the served model, status, cost, tokens, latency, time to first token, environment, and task tag.
Metrics turns those calls into filterable views for volume, errors, spend, tokens, and latency percentiles. Requests keeps the individual calls available for inspection and can turn filtered, deduplicated traffic into a new benchmark dataset. Payload capture has size and retention limits.
Metrics turns gateway traffic into an operational view of request volume, reliability, spend, token use, latency, and time to first token.Requests keeps the aggregate charts connected to the calls underneath them, with filters for expensive, slow, or failed traffic and a path from production traces back into a benchmark.
Downshift with evidence from live traffic
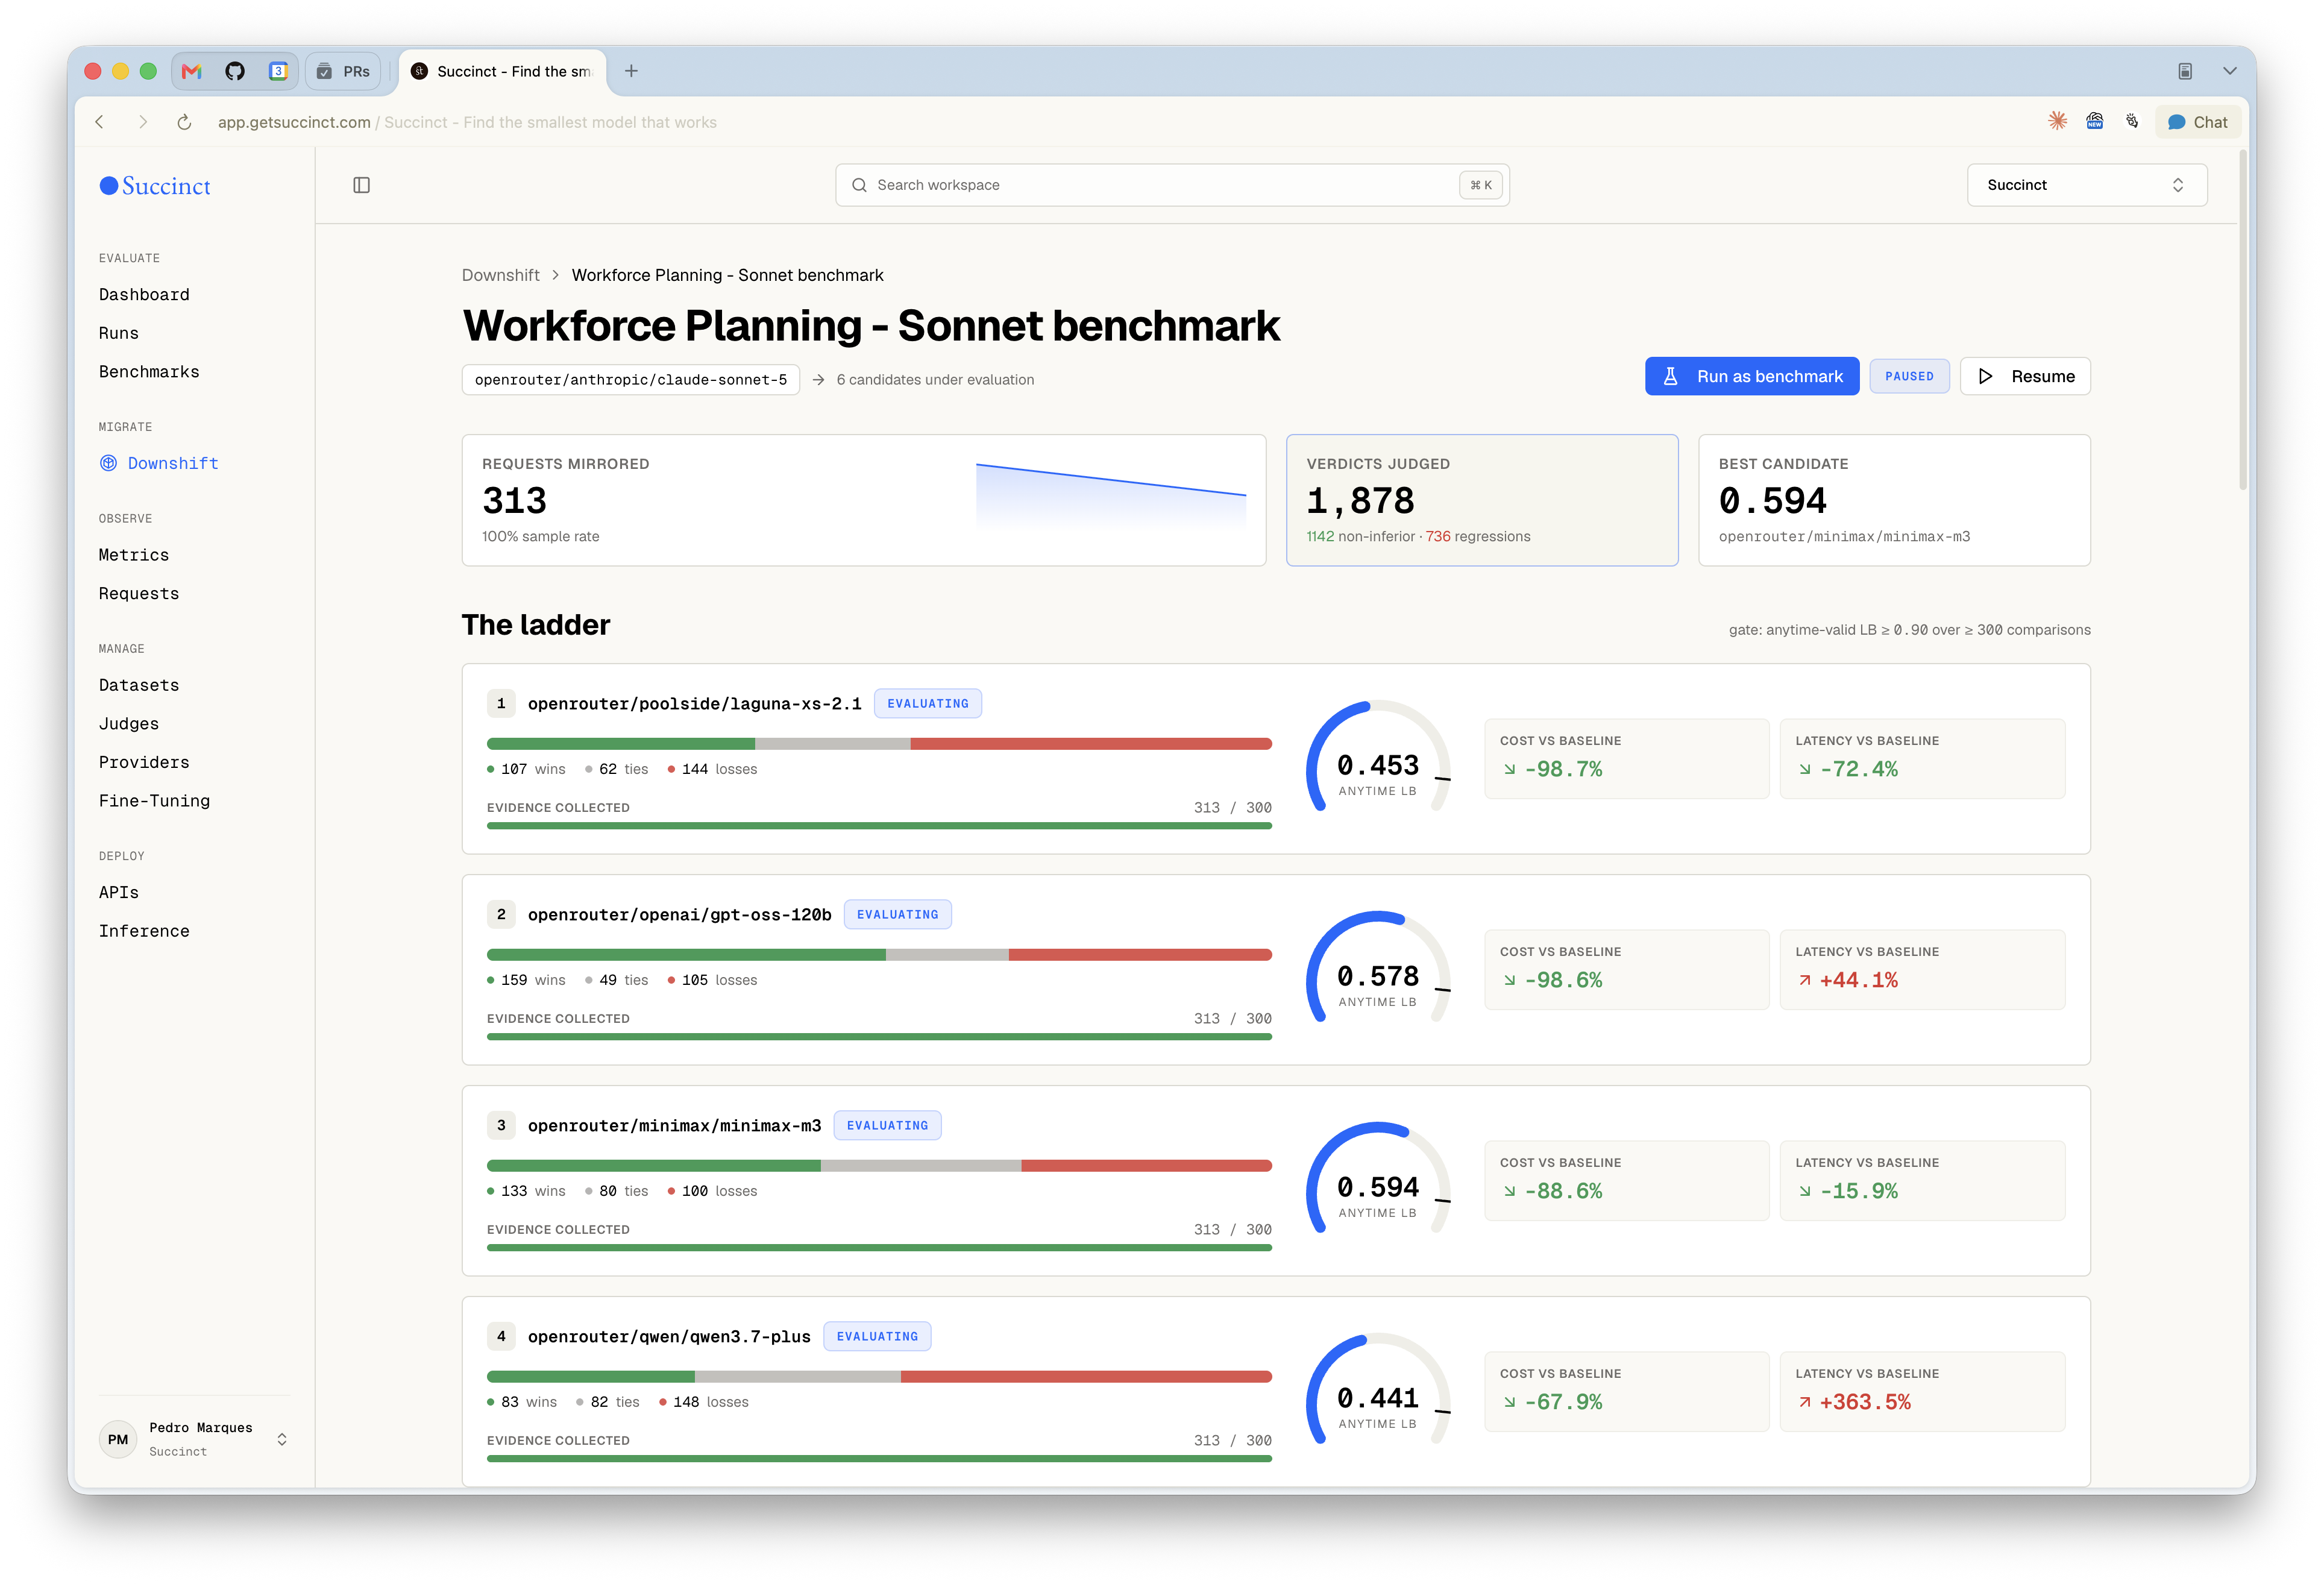
Downshift checks whether a cheaper model can handle traffic already passing through the gateway. The baseline response still goes back to the user. A sample of requests is replayed asynchronously against an ordered list of cheaper candidates.
Each replay is judged against the baseline. Wins, ties, losses, cost, and latency build an anytime-valid lower bound. Once a candidate has enough comparisons and clears the non-inferiority gate, the user can switch the gateway or save that traffic as a fixed benchmark.
The flow works, but I have only exercised it through proofs of concept. Downshift has not automatically switched a model on real production traffic.
The Downshift ladder keeps evidence volume, pairwise verdicts, statistical confidence, and cost and latency deltas together before any candidate is promoted.
Design details that make it useful
There is a lot to show, so I split it by decision. The first screen shows what to do next. Run setup shows exactly what will be evaluated. Results show what can ship and the evidence behind it.
Configuration stays visible. Dataset size, truth source, judge, max tokens, and model list remain adjacent to the result, so a screenshot of a run is still interpretable.
Examples explain the aggregate. Representative inputs, model outputs, ground truth, and judge reasons sit below the table so each failure can be inspected directly.
Cost stays visible. The interface shows total cost, cost per success, token usage, latency, and API spend because model choice affects the budget.
The deployment step is part of the workflow. API keys, provider config, usage logs, and rate limits turn evaluation output into a route that can be controlled in production.
Learnings
I built Succinct to learn how LLM evaluation and routing work underneath the tools: how to design a dataset, define a judge, use confidence bounds, replay live traffic, and keep cost attached to the decision.
The biggest lesson was to keep the evidence connected. A model recommendation only makes sense with its task, dataset, judge, samples, and configuration. Price tables are useful, but the measured cost of doing the actual job matters more.
The part I have not solved is privacy. Downshift becomes much more useful when it can see real application traffic, which means handling real prompts and responses. I have not yet worked out a responsible way to do that, especially for a European product. Privacy is the main reason I have not treated Succinct as fully launched. I need a clear position on how the product handles other people's data before pushing it further.